Data analytics
Mstat — Boxplot analysis
Educational documentation of boxplot analysis: median, quartiles, dispersion and outliers.
Documented academic exercise — individual contribution unspecified
All projects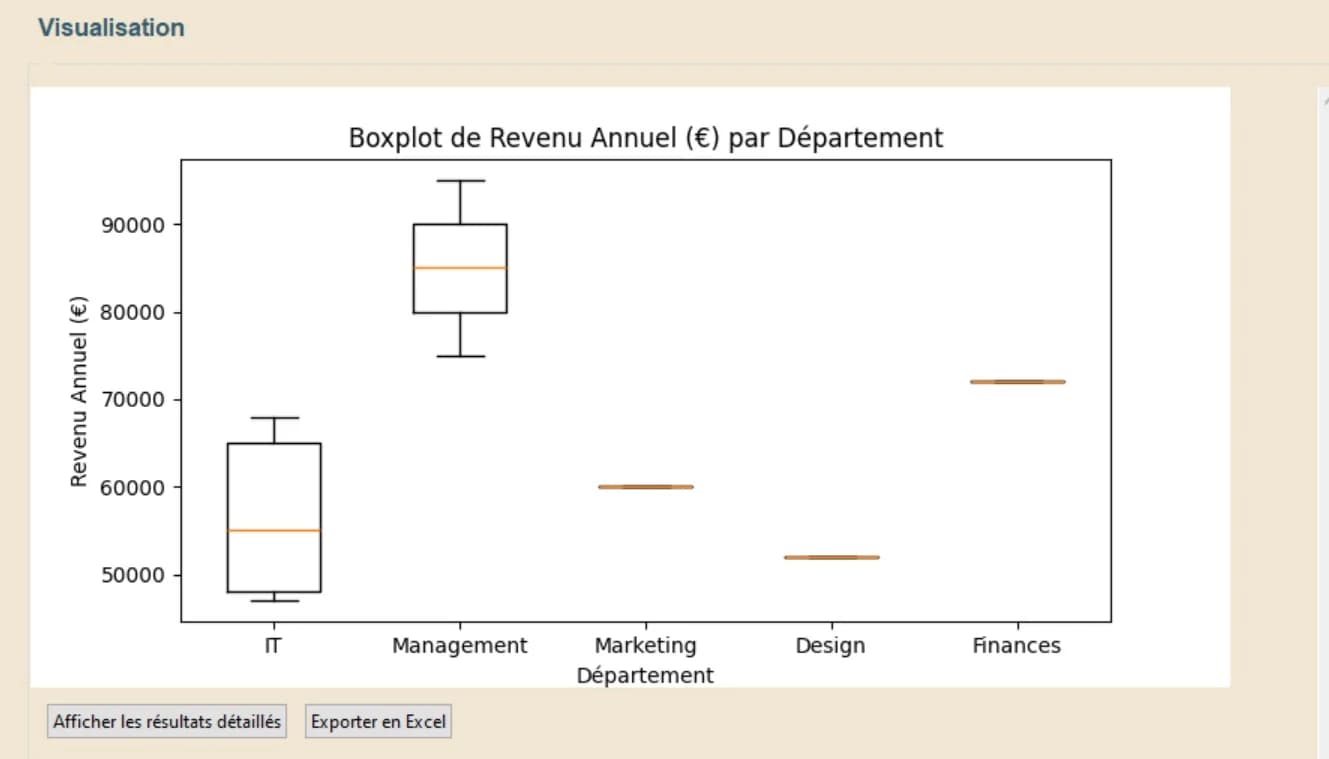
- Project type
- Academic
Overview
Seven-page documentation and a Python work-session recording concerning boxplots in Mstat. Screenshots illustrate variable selection and descriptive interpretation.
Contribution and project context
Documented academic exercise — individual contribution unspecified
Approach
Variable preparation
Selection of categorical and numerical variables in the documented interface.
Statistical interpretation
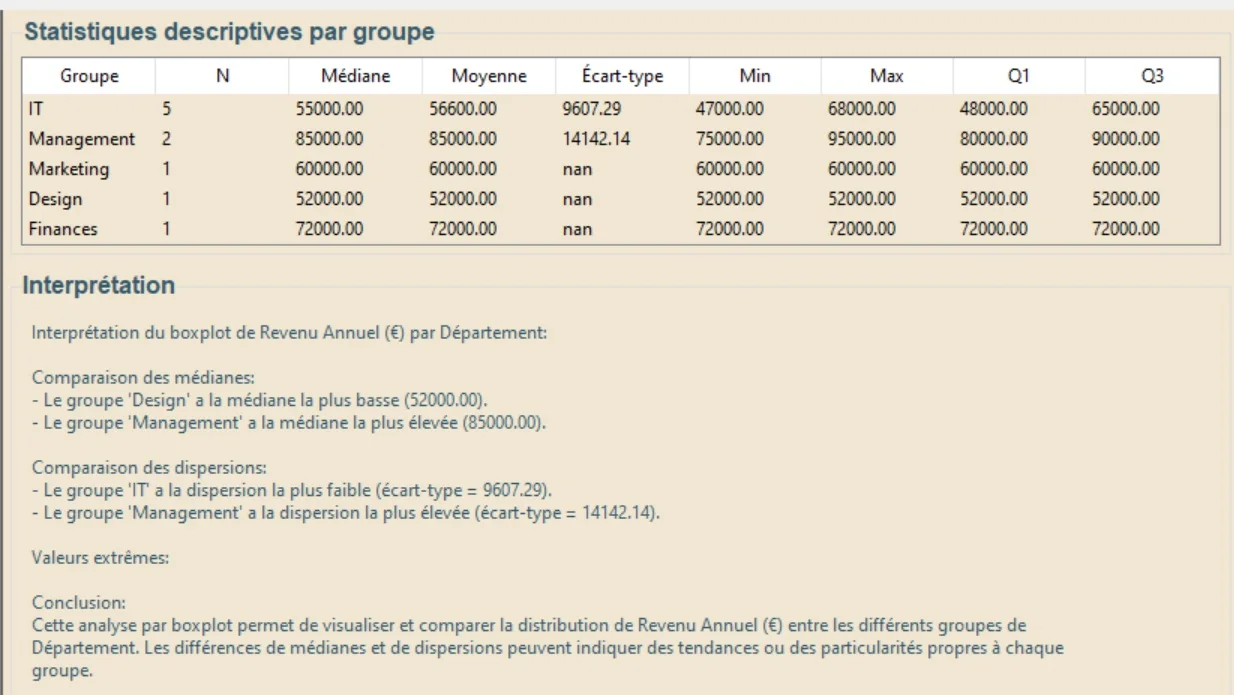
Median, quartiles, interquartile range and observations beyond the 1.5 × IQR rule.
Work and deliverables
Group comparison
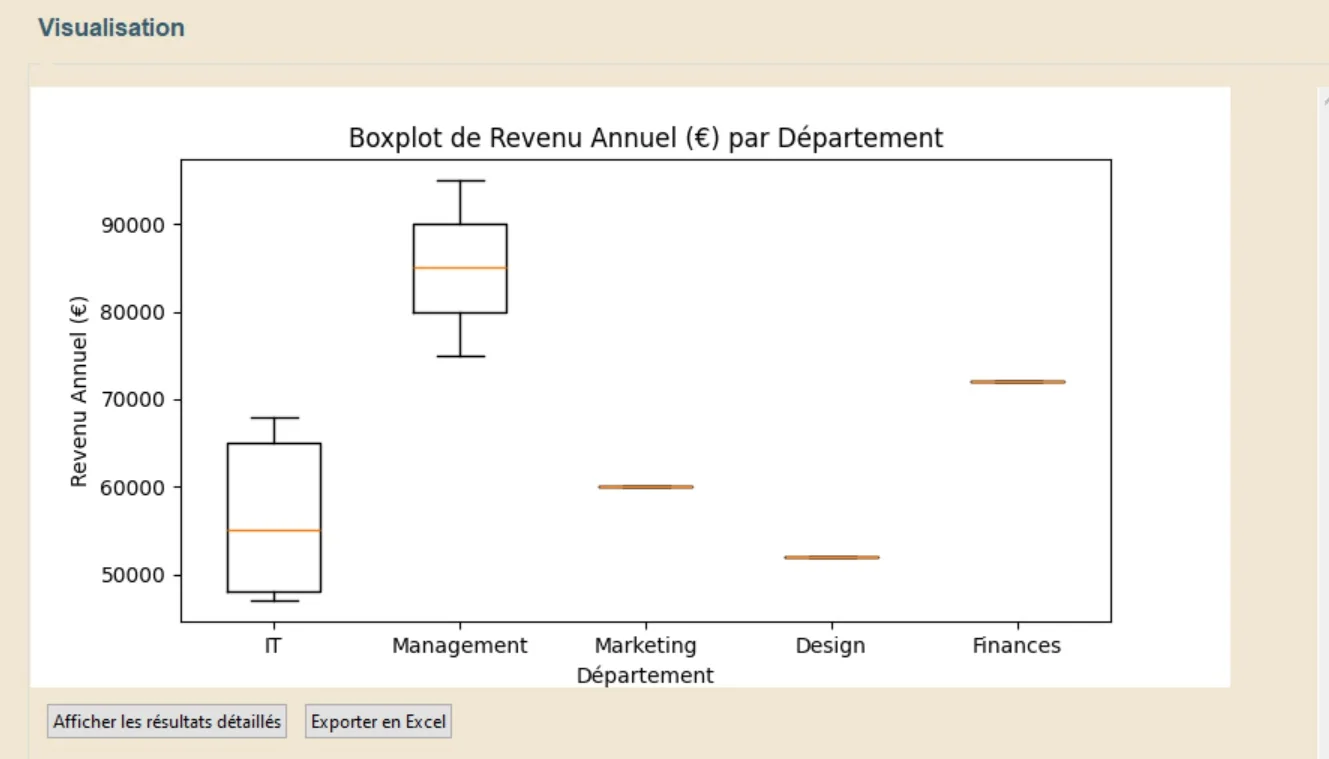
Boxplots and descriptive-statistics table reproduced from the document.
Educational presentation
Explanation of workflow and limitations when interpreting distributions.
Findings and recommendations
The example shows how to compare spread and central tendency without reducing a distribution to one average.
Tools and skills
Python · Descriptive statistics · Boxplot · IQR
Visual evidence from source materials
Verified video excerpt
Scope and limitations
No complete Mstat source code was supplied. Individual authorship of the application is not attributed to Aya. Distinct illustrative datasets in the document are not combined.
Verified sources
Créer une boite à moustaches (Boxplot).pdf
creer_une_boîte_à_moustaches_(boxplot) – Mstat.py 2025-03-16 17-09-39.mp4
More to explore
Python — Inventory management
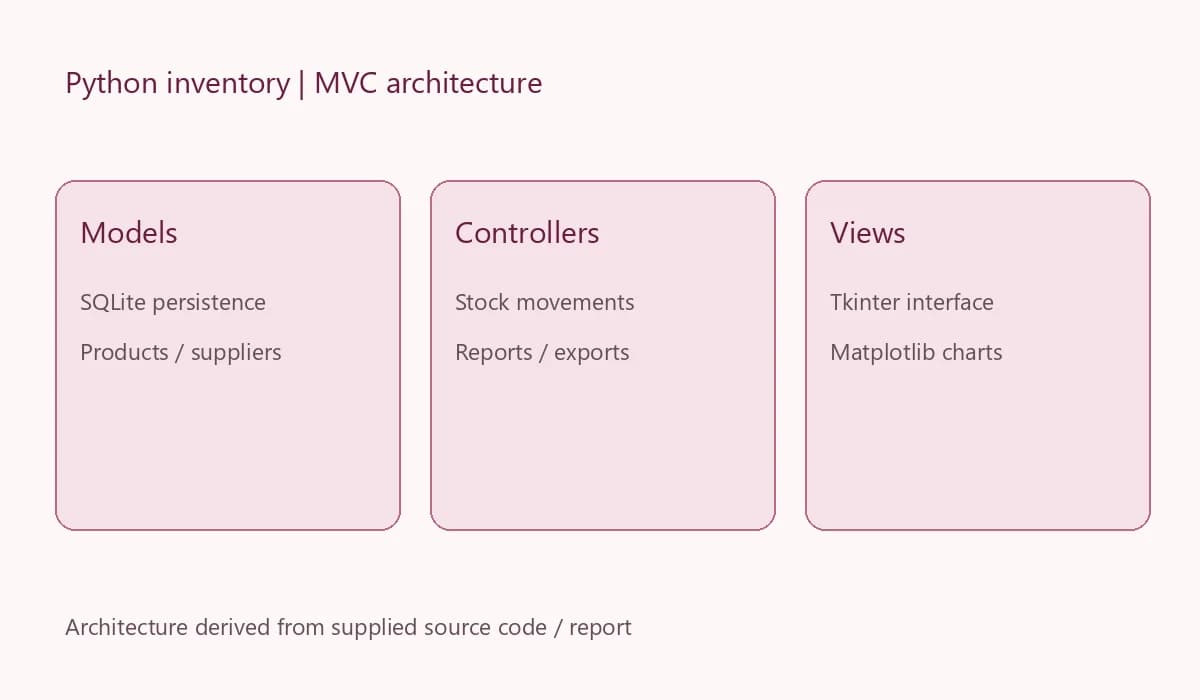
Tkinter and SQLite desktop application: products, suppliers, movements, dashboards and Excel exports.
Academic application — individual role not identified in the sources
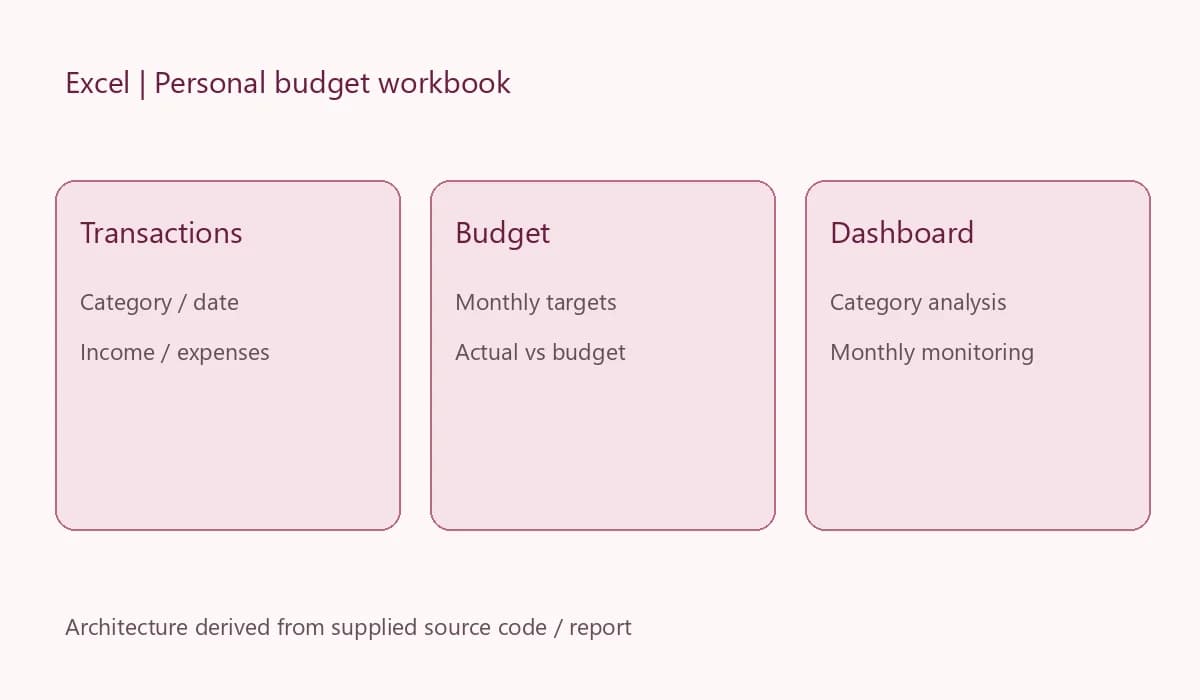
Excel & VBA — Personal budget
Transaction organization and monthly category-based budget tracking with Excel formulas and charts.
Academic team project